OCTOBER DATA CONFIRM THAT HOUSING IS IN FULL REBOUND
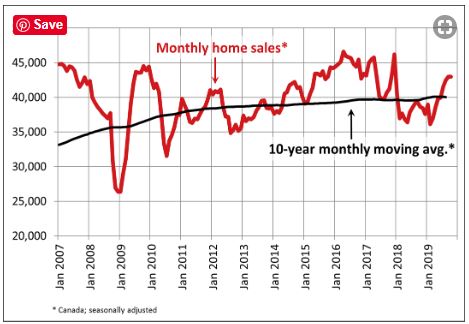
 Statistics released today by the Canadian Real Estate Association (CREA) show that national home sales rose for the eighth consecutive month. Activity held steady in October at the relatively robust September pace following a string of monthly increases that began in March. Existing home sales are now almost 20% above the six-year low reached in February 2019, but remain 7% below the heights reached in 2016 and 2017 when many fretted over a housing bubble (see chart below).
Housing activity in roughly half of the local markets rose offset by the other half that fell. Higher sales in Greater Vancouver (GVA), the neighbouring Fraser Valley and Ottawa offset a monthly decline in activity in the Greater Toronto Area (GTA), particularly in Central Toronto, and Hamilton-Burlington.
Actual (not seasonally adjusted) activity rose 12.9% year-over-year. Transactions were up from year-ago levels in 80% of all local markets in October, including all of Canada’s largest urban markets.
All was not rosy, however. “It’s a full-blown buyer’s market or on the cusp of one in a number of housing markets across the Prairies and in Newfoundland,” said Gregory Klump, CREA’s Chief Economist. “Homebuyers there have the upper hand in purchase negotiations and the mortgage stress-test has contributed to that by reducing the number of competing buyers who can qualify for mortgage financing while market conditions are in their favour.”
New Listings
The number of newly listed homes fell by 1.8% in October, with the GTA and Ottawa posting the most significant declines. Almost a third of all housing markets posted a monthly decrease of at least 5%, while about a fifth of all markets posted a monthly increase of at least 5%.
Steady sales and fewer new listings further tightened the national sales-to-new listings ratio to 63.7%. This measure has been increasingly rising above its long-term average of 53.6%. Its current reading suggests that sales negotiations are becoming more and more tilted in favour of sellers; however, the national measure continues to mask significant regional variations.
Based on a comparison of the sales-to-new listings ratio with the long-term average, just over two-thirds of all local markets were in balanced market territory in October 2019, including the GTA and Lower Mainland of British Columbia. Nonetheless, sales negotiations remain tilted in favour of buyers in housing markets located in Alberta, Saskatchewan and Newfoundland & Labrador.
The number of months of inventory is another important measure of the balance between sales and the supply of listings. It represents how long it would take to liquidate current inventories at the current rate of sales activity.
There were 4.4 months of inventory on a national basis at the end of October 2019—the lowest level recorded since April 2017. This measure of market balance has been retreating further below its long-term average of 5.3 months. While still within balanced market territory, its current reading suggests that sales negotiations are becoming more tilted in favour of sellers.
National measures of market balance continue to mask significant regional variations. The number of months of inventory has swollen far beyond long-term averages in the Prairie provinces and Newfoundland & Labrador, giving homebuyers an ample choice in these regions. By contrast, the measure is running well below long-term averages in Ontario, Quebec and Maritime provinces, resulting in increased competition among buyers for listings and providing fertile ground for price gains. The measure is still well centred within balanced market territory in the Lower Mainland of British Columbia.
Home Prices
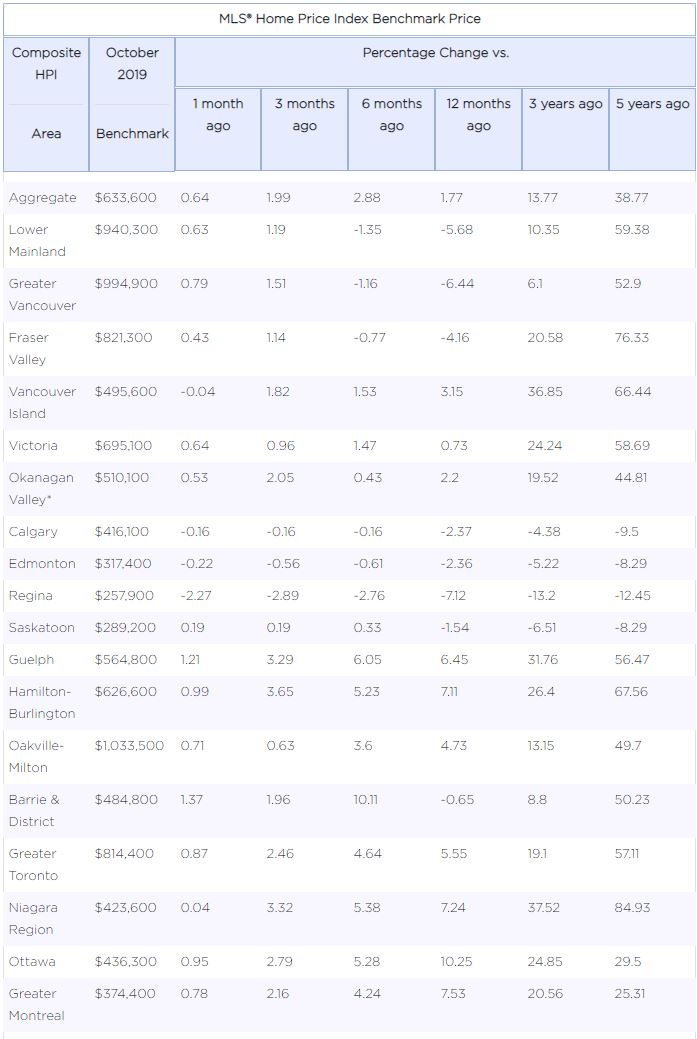
The Aggregate Composite MLS® Home Price Index (MLS® HPI) rose 0.6%, marking its fifth consecutive monthly gain. Seasonally adjusted MLS® HPI readings in October were up from the previous month in 14 of the 18 markets tracked by the index. (Table below)
Recently, home price trends have generally been stabilizing in the Lower Mainland and the Prairies. While that remains the case in Calgary and Saskatoon, home prices in Edmonton and Regina continue to decline. By contrast, home price trends have started to recover in the GVA and the neighbouring Fraser Valley.
Meanwhile, price growth continues to rebound in the Greater Golden Horseshoe (GGH). In markets further east, price growth has been trending higher for the last three or four years.
Comparing home prices to year-ago levels yields considerable variations across the country, with mostly declines in western Canada and mostly price gains in eastern Canada.
The actual (not seasonally adjusted) Aggregate Composite MLS® (HPI) was up 1.8% y-o-y in October 2019, the biggest year-over-year gain since November 2018.
Home prices in the GVA (-6.4%) and the Fraser Valley (-4.2%) are still below year-ago levels, although declines are becoming smaller.
Elsewhere in British Columbia, home prices logged y-o-y increases on Vancouver Island and in the Okanagan Valley (3.1% and 2%, respectively) while having edged marginally higher in Victoria (0.5% y-o-y).
Calgary, Edmonton and Saskatoon posted price declines in the range of -1.5% to -2.5% on a y-o-y basis in October, while the gap between this year and last year widened sharply to -6.8% in Regina.
In Ontario, price growth has re-accelerated well ahead of overall consumer price inflation across most of the GGH. Meanwhile, price growth in recent years has continued uninterrupted in Ottawa, Montreal and Moncton.
Bottom Line
This report is in line with other recent indicators that suggest housing has recovered from a slump earlier, helped by low mortgage rates. The run of robust housing data gave the Bank of Canada another reason– along with healthy job gains and higher wage rates — to hold interest rates steady. However, the central bank has become more cautious in its outlook. Bank of Canada Governor Stephen Poloz, one of the few central bankers to resist the global push toward easier monetary policy, acknowledged he’s begun to consider the merits of joining other countries in lowering borrowing costs.
At a press conference after the Bank of Canada’s decision to keep the current 1.75% policy interest rate unchanged for an eighth straight meeting, Poloz said his governing council discussed the possibility of implementing an “insurance” cut to counter the global economic headwinds. But, the council decided against it because of the potential costs to such a move. These include driving up inflation already at the central bank’s 2% target and fueling household debt levels that are among the highest in the world.
“Governing Council considered whether the downside risks to the Canadian economy were sufficient at this time to warrant a more accommodative monetary policy as a form of insurance against those risks, and we concluded that they were not,” Poloz said. The Bank of Canada “is mindful that the resilience of Canada’s economy will be increasingly tested as trade conflicts and uncertainty persist.”

